We use analytics and cookies to understand site traffic. Information about your use of our site is shared with Google for that purpose.You can read our privacy policies and terms of use etc by clicking here.
Model Explanations with Anchor Tabular
Launch an income prediction model and get explanations on tabular data.
In this demo we will:
- Launch an income classification model which has tabular training features
- Send a request to get a predicton
- Create an explainer for the model
- Send the same request and then get an explanation for it
This demo uses a model trained to predict high or low income based on demographic features from a 1996 US census.
The explanation will offer insight into why an input was classified as high or low. It uses the anchors technique to track features from training data that correlate to category outcomes.
Create Model
Use the model uri:
gs://seldon-models/sklearn/income/model-0.23.2

Get Predictions
Run a single prediction using the JSON below.
{
  "data": {
    "names": [
      "Age",
      "Workclass",
      "Education",
      "Marital Status",
      "Occupation",
      "Relationship",
      "Race",
      "Sex",
      "Capital Gain",
      "Capital Loss",
      "Hours per week",
      "Country"
    ],
    "ndarray": [
      [
        53,
        4,
        0,
        2,
        8,
        4,
        2,
        0,
        0,
        0,
        60,
        9
      ]
    ]
  }
}
Add an Anchor Tabular Explainer
Create an model explainer using the URL below for the saved explainer.
gs://seldon-models/sklearn/income/explainer-py36-0.5.2

Get Explanation for one Request
Resend a single request and then explain it using the JSON below:
{
  "data": {
    "names": [
      "Age",
      "Workclass",
      "Education",
      "Marital Status",
      "Occupation",
      "Relationship",
      "Race",
      "Sex",
      "Capital Gain",
      "Capital Loss",
      "Hours per week",
      "Country"
    ],
    "ndarray": [
      [
        53,
        4,
        0,
        2,
        8,
        4,
        2,
        0,
        0,
        0,
        60,
        9
      ]
    ]
  }
}
Make the prediction again and go to the ‘Request Logs’ screen. From there you can click through to the explanation with full feature names.
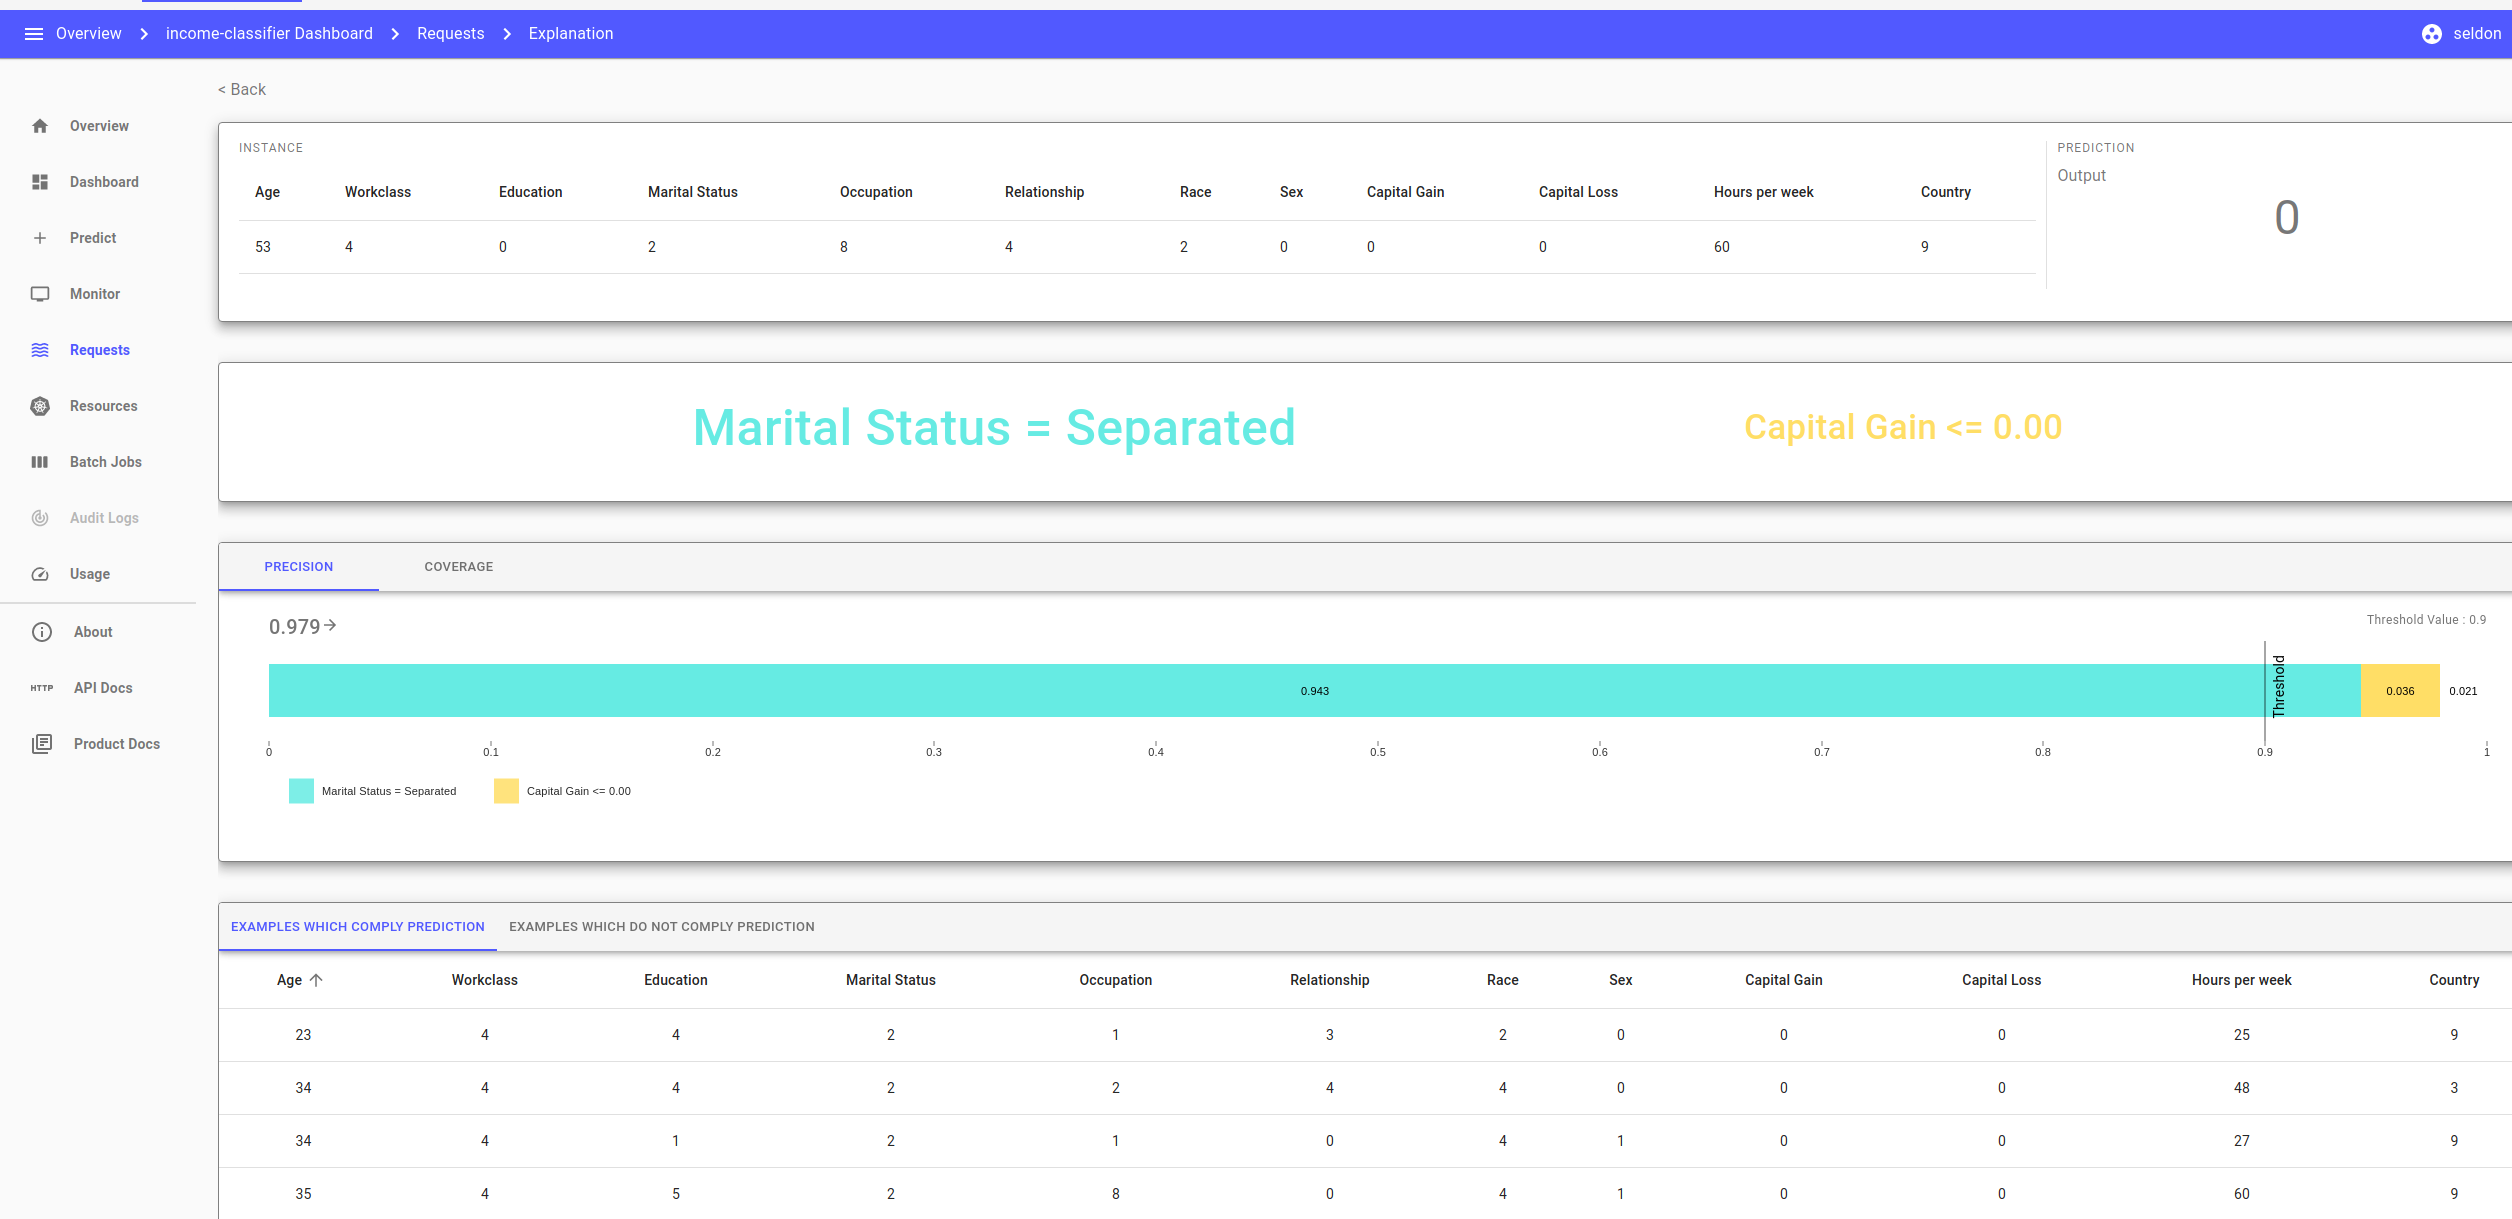
The anchors reveal which features most contributed to the classification of ‘Low Income’. Here, for nearly 98% of the training data a Marital Status of ‘Separated’ correlates to Low Income. Having no Capital Gain also correlates but is a less strong indicator.
At the bottom we are shown other examples of Low Income data points. This helps to reveal the patterns that the model is relying on to make predictions.
Last modified May 25, 2021